2018 Warehouse/Distribution Center Equipment Survey

felix
felix 这家伙很懒,还没有设置简介

0 人点赞了该文章 · 903 浏览

2018 Warehouse/Distribution Center Equipment Survey — Automation & Robotics Lead Robust Outlook 关键点:
  1. 设备投资前景将是乐观的。受访者表示他们正在“进行投资”的比例达到了四年来的最高水平。
  2. 人们越来越关注使用相对较新的技术,包括机器人,无人驾驶飞机和智能眼镜。
  3. 平均拥有131,2675平方英尺的DC空间。受访者平均分布在多个行业,其中最常见的是食品和饮料,工业机械,零售贸易,电子产品,
  4. 表现强劲增长的类别包括自动化存储和检索(AS / RS)系统,仓库控制系统(WCS)软件和仓库执行系统(WES)软件以及机器人等紧密相关类别。
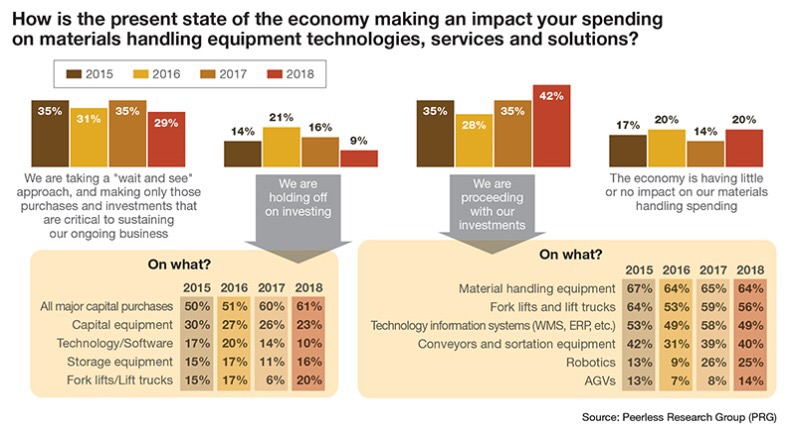
Our annual survey reveals a bullish outlook for continued material handling investments, with enthusiasm extending into newer technologies such as robotics as well as warehouse control system software and the closely related category of warehouse execution systems. By Roberto Michel · March 1, 2018 If there were one clear-cut conclusion to be drawn from our “2018 Warehouse and Distribution Center (DC) Equipment Survey,” it would be that the outlook for spending is bullish. The percentage of respondents saying that they’re “proceeding with investments” reached its highest level in four years, and the percent of respondents saying that they’re “holding off” on material handling solutions shrank by 7%. However, the purse strings aren’t being held wide open across the board. A few subcategories saw tepid or declining indications, and generally, respondents seem more interested in specific types of material handling equipment, rather than large scale information systems (IS) spending. At the same time, the survey revealed growing interest in the use of relatively new types of technology, including robotics, drones and smart glasses. These new technologies have to be supported and integrated into information technology (IT) systems. 2018 respondent demographics Peerless Research Group’s (PRG) e-mail survey questionnaire was sent to readers of Logistics Management and Modern Materials Handling in January of 2018, yielding 315 qualified respondents. The respondents were from sites whose primary activity is manufacturing (36%), corporate headquarters (28%), warehousing and distribution (24%), as well as warehousing supporting manufacturing and other. The median revenue of responding companies is $67 million, while the average is $271.45 million. Qualified respondents—managers and personnel involved in the purchase decision process for materials handling solutions—hold influence over an average of 131,2675 square feet of DC space. Respondents were spread pretty evenly across multiple verticals, with a few of the most common ones being food & beverage, industrial machinery, retail trade, electronics, and transportation/warehousing services. Peerless Research Group’s (PRG) annual survey, conducted in January of this year, found that 42% of respondents were proceeding with investments given the state of the economy, up from a 35% response to the same question in early 2017. That’s the highest, most positive measure for this question over the last four years. Similarly, only 9% said they were “holding off” on investments, well under the 16% in 2017. While the overall outlook is positive, there were some lagging categories, though even these showed some resilience when looked at across related questions. The categories that exhibited strong growth included jumps in investments for automated storage & retrieval (AS/RS) systems, warehouse control system (WCS) software, and the closely related category of warehouse execution systems (WES) software as well as robotics. So, after years of the survey reflecting growing investment in systems for distribution centers (DCs), what’s different this year?
22D8E728-43A7-4E6E-AA9A-DE90727BEA8D.jpeg
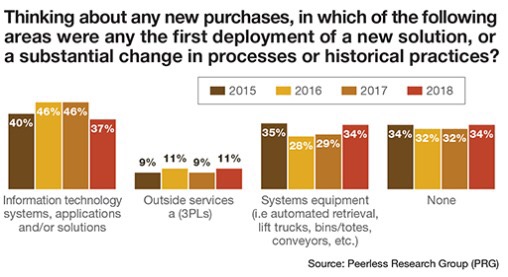
It may be that a rising stock market and a continued strong economy, when combined with unrelenting operational pressures around e-commerce fulfillment, have many industry participants moving forward with focused investments in automation to help address the challenges. Additionally, after a few years of increasing investment indications for IS solutions, many companies may feel they have a solid IT foundation. “Where the respondents appear to be spending more is on automation such as conveyors and specific applications like vertical lift modules and put walls,” says Norm Saenz, managing director with St. Onge Company, a supply chain engineering and consulting firm. “While there are clear indications for growth in the survey, I believe companies are being tactical about investments. They want investments that will bring them quick improvements, while some are thinking about outsourcing.” Indeed, when it comes to new purchases, areas with rising interest not only included equipment such as AS/RS, lift trucks, bins/totes, and conveyors—a broad category that rose from a 29% response last year to 34% this year—but also outside services such as third-party logistics providers (3PLs). Interest in new 3PL services rose by 2%, and when looking at areas for investment over the next 18 months, outsourcing to 3PLs is up by 5%. The impact of e-commerce is likely influencing spending priorities, as it has for years. For example, 29% of respondents say that in their operations, they support a “buy online, ship to customer from DC” process. Additionally, when asked about “very important” industry issues today as well as two years from now, 29% deem multichannel fulfillment very important today, and 34% see it as very important in two years. Overall outlook High confidence in the economy appears to have eased reluctance when it comes to investing in material handling. This year, only 29% of respondents said they are taking a “wait and see” approach on spending given the current state of the economy, down from 35% in early 2017—the lowest measure for this question in four years. However, some measures for spending outlook essentially stayed even with last year, which was a strong year for spending outlook. For instance, 52% of respondents said they expect spending on material handling systems to increase in the next two to three years, which is down 2% from that question last year. However, 43% expect to spend the same amount in two/three years, up from 38% from last year. And this year, just 5% expect a decrease in spending in the next two/three years, compared to 8% in 2017. Additionally, when asked how spending for the current year compared to the previous year, this year 38% said it increased, down 1% from last year’s 39%. Additionally, 51% said spending stayed about the same, 3% higher than last year’s 48%. When asked to look forward to spending in the coming year, 40% anticipate an increase, which is the same as last’s year’s 40% response for this question. When it comes to spending expectation in dollar ranges, average anticipated spending over the next 12 months is $350,000 for 2018, down from $378,000 last year, while median comes in at $68,750, down from $82,610 in 2017. Some of this may relate to a slight decline in annual revenues for respondents on average, and it also may tie into the fact that 2017 saw steep increases for this question over 2016, so 2018 follows a strong year. Another factor worth noting with anticipated spending is that 27% of respondents indicate that they will spend $250,000 or more, and of this segment, 6% will spend between $1 million and $2.49 million, and another 6% will spend $2.5 million or more. Respondents with companies that have a pre-approved budget for capital spending on materials handling are set to spend more significantly than other respondents. This year, 35% said they have a pre-approved budget, down slightly as a percentage from last year, but of these respondents, the average budget is $457,640, up from $422,260 last year. “Overall, the survey reflects enthusiasm for where things are going with the economy in general, and with supply chain activity in particular,” says Donald Derewecki, a senior consultant with St. Onge. “There are exceptions in that some companies are perhaps smaller or are not in a position to spend much, but at the same time, there’s a significant segment of respondents planning to spend $250,000 or more—which is when you start to get into some real projects. The caution here is that if you’re not investing in technology, especially in a growth economy, then your competitors are going to eat your lunch.” Some ups and downs As highlighted earlier, growth categories in the survey tended to be for various types of warehouse automation as well as a boost in spending for WCS/WES software, which is often used in automation projects to synchronize automated equipment with material flow and higher-level systems. For example, when asked which type of systems and equipment respondents are considering during the next 12 months, growth categories included AS/RS (up to 14% from 7% last year), order picking and fulfillment systems (up to 17% from 13%), as well as mezzanines (up by 4% this year versus last), and conveyor/sortation (up by 3%).
550AB165-B93E-44C3-8FF8-7FFEA3AEEEE7.jpeg
When asked about current robotics use and whether they will evaluate robotics during the next 24 months, 16% said that they currently use robotics, while 15% are evaluating robotics, for a total of 31% now either using or considering robotics. That’s up from last year, when 9% said they use robotics and 13% were considering robotics. For applications, using or considering robotics for pick and place or parts transfer climbed by 8% to reach 41%, while using or considering robotics for palletizing declined by 8%. Use or consideration of robotics for pick to cart, order fulfillment (picker to part), truck loading, and transportation also were on the upswing. “Greater functionality with robotics, more flexibility of applications, and lower costs are driving this spike in current usage and evaluation of potential use,” says Derewecki. “As labor availability becomes tighter and labor costs increase, demand for this technology will increase.”
AD7BA054-978A-4235-92CD-9654F8110162.jpeg
Spending indications for automated guided vehicles (AGVs) also were up. For 2018, 7% use AGVs, up 1% from last year, while 14% said that they’re evaluating use of AGVs during the net 24 months, which is up 2% from last year. Spending plans for IS didn’t grow as strongly. When asked about new purchases, plans for IT/IS systems were at 37% this year, down from 46% the two previous years. However, when asked about 12-month plans for specific types of IS solutions, such as warehouse management system (WMS) and enterprise resource planning (ERP) software, each of these subcategories was up by 2%. Plans for spending on transportation management system (TMS) software over the next 12 months also ticked up slightly. The high growth subcategories within IS were WCS, up to 18% in 2018 from 12% last year, and WES, up to 16% this year from 6% in 2017, which was the first year the survey asked about WES. The WCS and WES categories are closely related, with many WES solutions having evolved from a WCS by adding functions like wave management, pick to light control, replenishment, or voice picking. It may well be that since investment in automated equipment is up generally, WCS/WES benefits from that. “It’s not surprising to see growth in WCS and WES, because these systems have a control system aspect to them that is needed for automation projects,” says Saenz. “So, some companies are looking not just to control the movements of an automated system with one of these systems, but to leverage more of the higher-level functions that can be deployed under a WES, like managing waves, or managing some of the movement of inventory and people.” Also down were a few indications on spending on mobile computing solutions. In this section of the survey, 54% are using or have plans for mobile technologies, which is down from 62% in 2017, though close to the 57% for this question in 2016 and 2015. However, when asked earlier in the survey about bar coding and automated data capture, 48% have plans for these functions in 2018, up by 3% from 2017. Under the mobile computing section, respondents indicate growing interest in some of the newer technologies. For example, 8% said they use drones, and in 12 months, 17% said they would either be using drones or planning to deploy them. Similarly, only 3% use smart glasses today, but 7% said they plan to use them or will be using them in 12 months. The e-commerce effect When asked which is currently the most common process for e-commerce fulfillment in their operation, “buy online and ship to customer from DC” is again the most common process, drawing a 29% response, same as in 2017. This year, the growth process was “buy online ship to customer from vendor,” which stood at 8% in 2017, but went up to 15% this year. Other choices for the most common process for e-commerce remained fairly steady or grew just a bit, such as “buy online, ship from store” (up 2% this year) and “buy online, pick up in store” (up 1% to 4% this year). When asked which e-commerce process will be the most common in two years, both “buy online and ship to customer from vendor” and “buy online ship to customer from DC” are expected to grow. Specifically, 20% said “buy online, ship to customer from vendor” will be the most common process for them in two years, up from 10% last year, while 40% foresee “buy online, ship to customer from DC” as being the most common process in two years, up from 35% last year. The impact of e-commerce is likely influencing change in issues respondents see as very important. When asked what issues are “very important” today, 52% rated “cycle times,” while 56% see it as “very important” in two years. E-commerce has many affects, but “tighter cycle times” is certainly one of them. Additionally, when asked to rate the importance of multichannel fulfillment, 29% see it as “very important” today, and 34% said it will be “very important in two years.” Other issues seen as rising in importance in two years include company growth, capital availability, and having a presence in global markets. Overall, the top answers for “very important” issues remained fairly steady with previous surveys. The top five issues this year were safety, cost containment, company growth, training and labor availability. The only change from last year’s top five was that labor availability rose to the 5th spot, and “throughput” fell to 6th. This year, 65% see labor availability as “very important,” and 63% said it will be “very important in two years.”
0E9F9059-B506-4716-9709-30B27D55A19B.jpeg
Whether some respondents foresee an increase in the labor pool or expect automation investments will ease labor requirements may be possible reasons for why the labor availability isn’t seen as accelerating further in importance. Interestingly, however, when asked in which areas they will invest over the next 18 months, “staffing/labor” drew a 52% response, up from a 49% response last year. When it comes to best practices around measuring productivity, the survey indicated interest in more tightly managing fulfillment processes, and moving to a more automated means of doing so in the next two years. For example, currently only 35% of respondents have an automated means of tracking order cycle times, 46% track them manually, and 19% don’t track them. However, when asked how they’ll be gauging cycle time performance in two years, 57% expect they will have an automated means of tracking cycle times, 29% expect they’ll be tracked manually, and those that don’t track cycle time drops to 14%. Other areas in which respondents expect closer, more automated tracking include “picking accuracy” (automated jumps from 30% today to 54% in two years), and “order fulfillment costs” (for which automated jumps from 34% today to 52% in two years). While the survey doesn’t ask respondents to specify how they plan to achieve automated measures, generally speaking, investments in WCS/WES, WMS and labor management, as well as certain automated systems, can help an organization keep track of various productivity measures in an online, systematic way. Best practices The survey asked questions about utilization/activity level for manufacturing, warehousing supporting manufacturing, and standalone DC facilities, as well as best practices for manufacturing and DC operators. For manufacturing respondents, average percent capacity utilization came in at 68%, equal to last year. However, 15% reported that they were at 100% capacity, while 19% were at 81% to 99% capacity. Looking forward for the next two years, 53% expect increased utilization, while only 5% expect a decrease. Continuous improvement is the leading best practices among respondents in manufacturing, followed by labor productivity, lean manufacturing, build to order, and just-in-time (JIT) methods. Respondents were also asked to rate the importance of best practices to their operations two years from now. Practices rated as growing in importance in two years are labor productivity (up 4%), lean (up 4%), and JIT (up 5%). Though not among the top best practices today, 3D printing, seen as important by 10% today, but 17% say it will be important in two years.
1B0FA550-F482-4682-B5C6-E1032533E9D0.jpeg
For standalone DCs, activity/capacity level averaged 66%, down 1% from 2017. However, 21% said they were at 100% capacity, and another 15% are in the 81% to 99% range. Looking forward to the next two years, 38% of respondents with standalone DCs expect an increased utilization level, 58% expect it to stay about the same, 4% expect a decreased level. While these capacity measures trend relatively low overall given the strong economy, Derewecki points out the significant chunk of respondents running at full capacity or over 80%. “While some aren’t faring that well with utilization in this growth economy, there’s a significant segment of respondents whose growth and capacity limitation issues are going to have to be addressed soon if not immediately.” Overall, the survey points to an industry that continues to invest to keep up with economic growth and operational challenges in this era when e-commerce fulfillment and tighter cycle times are common challenges for many companies, not just big e-tailers. Respondents appear to be most interested in specific types of automated equipment to increase productivity and throughput in their DC operations, and help lessen problems with labor availability, which has risen to become a critical industry issue. Although investment in IS is down in some responses, this comes after years of growing investments in IS and software systems under the IS banner. Additionally, when asked about specific types of IS investments, some categories of software show continued investment interest or modest growth, with WES/WCS, a category directly tied to control of automated equipment, making strong gains. As Saenz notes, the survey does reflect confidence in the economy and willingness to move forward on projects, but many are being selective, or considering more 3PL services to quickly address needs. “I think many companies are being smart about investing in some targeted types of automation,” he says. “E-commerce pressures are likely pushing the overall direction. Companies are looking for systems that will help them compete and be effective as more get involved in e-commerce or are getting pulled into fulfillment for big online marketplaces.” About the Author Roberto Michel Roberto Michel, an editor at large for Modern Materials Handling (MMH), has covered manufacturing and supply chain management trends since 1986, mainly as a former staff editor and former contributor at Manufacturing Business Technology. He has been a contributor to MMH since 2004. He has worked on numerous show dailies, including at ProMat, the North American Material Handling Logistics show, and National Manufacturing Week. He can be reached at robertomichel@centurylink.net.  

发布于 2018-03-03 15:00

免责声明:

本文由 felix 原创发布于 大董知识库 ,著作权归作者所有。

登录一下,更多精彩内容等你发现,贡献精彩回答,参与评论互动

登录! 还没有账号?去注册

暂无评论

All Rights Reserved Powered BY WeCenter V4.1.0 © 2023 京ICP备16065701号